An interactive spectrum normalizer
The following script uses the matplotlib widget to normalise a spectrum using a spline fit on user-defined points.
When saved to file specnorm.py, the user can invoke the script via the terminal with the command:
$:> python specnorm.py HD50230.txt
or any other text file containing two columns (wavelength, flux). You can download the example file here.
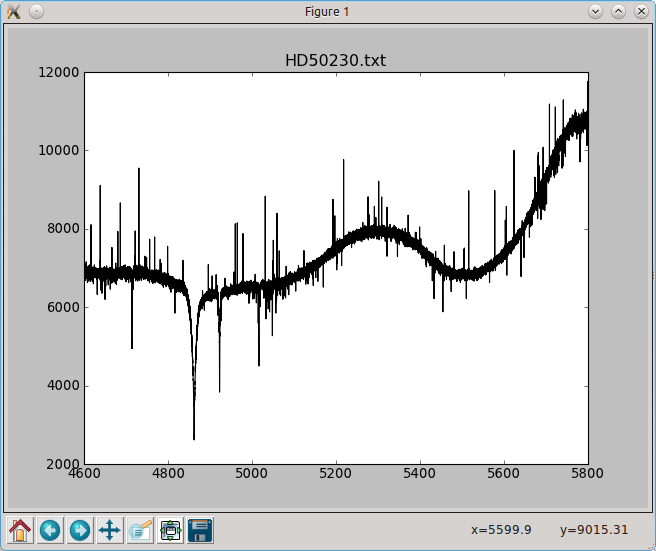
When started, you get a window like this:
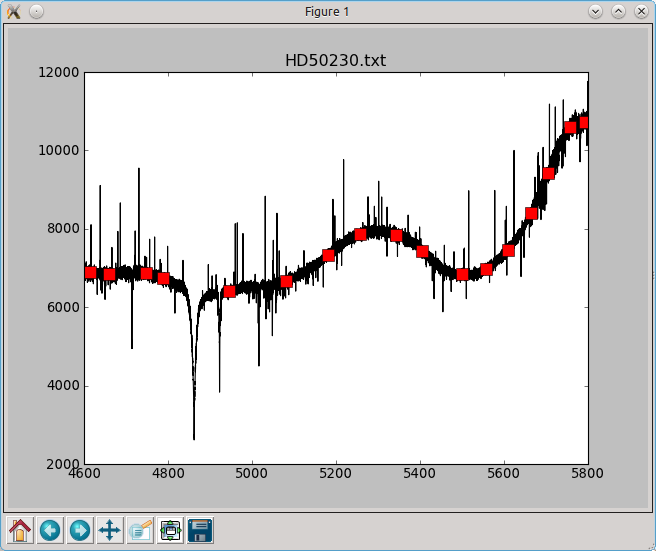
A user can left/right-click to select/deselect continuum points:
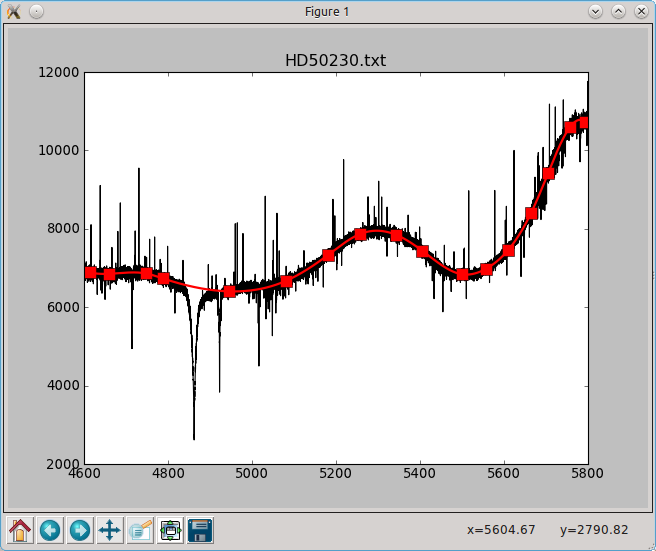
Hitting enter fits the splines throught the continuum points:
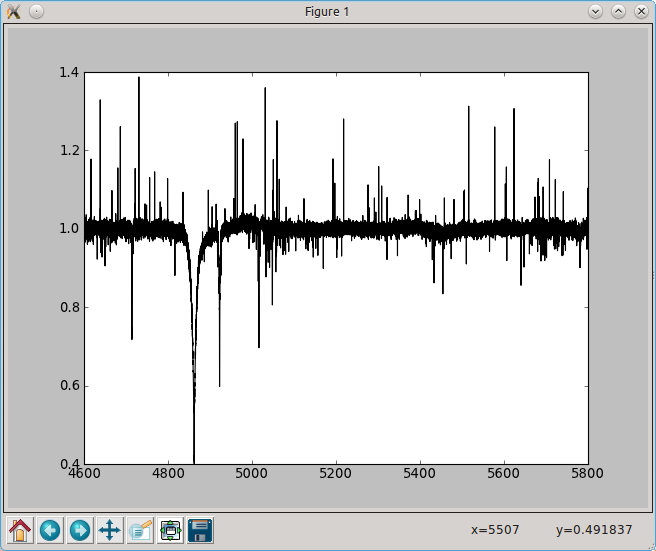
Hitting n normalises the spectrum:
The user can write the result to a file with w and reset to the original spectrum with r.
import pylab as plt
import numpy as np
from scipy.interpolate import splrep,splev
import sys
import os

def onclick(event):
    # when none of the toolbar buttons is activated and the user clicks in the
    # plot somewhere, compute the median value of the spectrum in a 10angstrom
    # window around the x-coordinate of the clicked point. The y coordinate
    # of the clicked point is not important. Make sure the continuum points
    # `feel` it when it gets clicked, set the `feel-radius` (picker) to 5 points
    toolbar = plt.get_current_fig_manager().toolbar
    if event.button==1 and toolbar.mode=='':
        window = ((event.xdata-5)<=wave) & (wave<=(event.xdata+5))
        y = np.median(flux[window])
        plt.plot(event.xdata,y,'rs',ms=10,picker=5,label='cont_pnt')
    plt.draw()

def onpick(event):
    # when the user clicks right on a continuum point, remove it
    if event.mouseevent.button==3:
        if hasattr(event.artist,'get_label') and event.artist.get_label()=='cont_pnt':
            event.artist.remove()

def ontype(event):
    # when the user hits enter:
    # 1. Cycle through the artists in the current axes. If it is a continuum
    #    point, remember its coordinates. If it is the fitted continuum from the
    #    previous step, remove it
    # 2. sort the continuum-point-array according to the x-values
    # 3. fit a spline and evaluate it in the wavelength points
    # 4. plot the continuum
    if event.key=='enter':
        cont_pnt_coord = []
        for artist in plt.gca().get_children():
            if hasattr(artist,'get_label') and artist.get_label()=='cont_pnt':
                cont_pnt_coord.append(artist.get_data())
            elif hasattr(artist,'get_label') and artist.get_label()=='continuum':
                artist.remove()
        cont_pnt_coord = np.array(cont_pnt_coord)[...,0]
        sort_array = np.argsort(cont_pnt_coord[:,0])
        x,y = cont_pnt_coord[sort_array].T
        spline = splrep(x,y,k=3)
        continuum = splev(wave,spline)
        plt.plot(wave,continuum,'r-',lw=2,label='continuum')

    # when the user hits 'n' and a spline-continuum is fitted, normalise the
    # spectrum
    elif event.key=='n':
        continuum = None
        for artist in plt.gca().get_children():
            if hasattr(artist,'get_label') and artist.get_label()=='continuum':
                continuum = artist.get_data()[1]
                break
        if continuum is not None:
            plt.cla()
            plt.plot(wave,flux/continuum,'k-',label='normalised')

    # when the user hits 'r': clear the axes and plot the original spectrum
    elif event.key=='r':
        plt.cla()
        plt.plot(wave,flux,'k-')

    # when the user hits 'w': if the normalised spectrum exists, write it to a
    # file.
    elif event.key=='w':
        for artist in plt.gca().get_children():
            if hasattr(artist,'get_label') and artist.get_label()=='normalised':
                data = np.array(artist.get_data())
                np.savetxt(os.path.splitext(filename)[0]+'.nspec',data.T)
                print('Saved to file')
                break
    plt.draw()


if __name__ == "__main__":
    # Get the filename of the spectrum from the command line, and plot it
    filename = sys.argv[1]
    wave,flux = np.loadtxt(filename).T
    spectrum, = plt.plot(wave,flux,'k-',label='spectrum')
    plt.title(filename)

    # Connect the different functions to the different events
    plt.gcf().canvas.mpl_connect('key_press_event',ontype)
    plt.gcf().canvas.mpl_connect('button_press_event',onclick)
    plt.gcf().canvas.mpl_connect('pick_event',onpick)
    plt.show() # show the window
